2nd Quarter 2021 Supplemental Financial Information August 26, 2021 Exhibit 99.2
A WARNING ABOUT FORWARD-LOOKING STATEMENTS This presentation contains "forward-looking statements" as that term is used in the Private Securities Litigation Reform Act of 1995. Forward-looking statements can be identified by the fact that they address future events, developments or results and do not relate strictly to historical facts. Any statements contained in this presentation that are not statements of historical fact may be deemed to be forward-looking statements. Forward-looking statements include, without limitation, statements preceded by, followed by or including words such as: “aim”, “believe”, “anticipate”, “expect”, “intend”, “plan”, “view”, “target” or “estimate”, “may”, “will”, “should”, “predict”, “possible”, “potential”, “continue”, “strategy”, and similar expressions. For example, our forward-looking statements include statements regarding our plans and expectations concerning various initiatives, including the expansion of Dollar Tree Plus!, Family Dollar H2 stores and Combo Stores (which are dependent on supply chain performance and continued store performance); the growth potential of our Combo Store initiative in rural and other demographic markets; our expectations of continued volatility and uncertainty related to the COVID-19 pandemic, and other macroeconomic factors; our estimates and assumptions for consolidated net sales, comparable store net sales and diluted earnings per share for the third quarter and full year fiscal 2021; our expectations of higher freight costs for the third and fourth quarters and full year fiscal 2021, including the impact of higher freight costs on our profitability and margins and our efforts to mitigate the effects of such costs; our expectations regarding the ability of our ocean carriers to fulfill their contractual capacity commitments to us; our expectations regarding our increased use of ocean carriers charging higher spot market rates and the potential for continued increases in spot market rates; our expectations concerning the duration and impact of shipping disruptions on results of operations; our expectations regarding capital expenditures and share repurchases for fiscal 2021; our plans relating to new store openings and store renovations and relocations; and our other plans, objectives, expectations (financial and otherwise) and intentions. These statements are subject to risks and uncertainties. For a discussion of the risks, uncertainties and assumptions that could affect our future events, developments or results, you should carefully review the "Risk Factors," "Business" and "Management's Discussion and Analysis of Financial Condition and Results of Operations" sections in our Annual Report on Form 10-K filed March 16, 2021, our Form 10-Q for the most recently ended fiscal quarter and other filings we make from time to time with the Securities and Exchange Commission. We are not obligated to release publicly any revisions to any forward-looking statements contained in this presentation to reflect events or circumstances occurring after the date stated on the cover page and you should not expect us to do so.
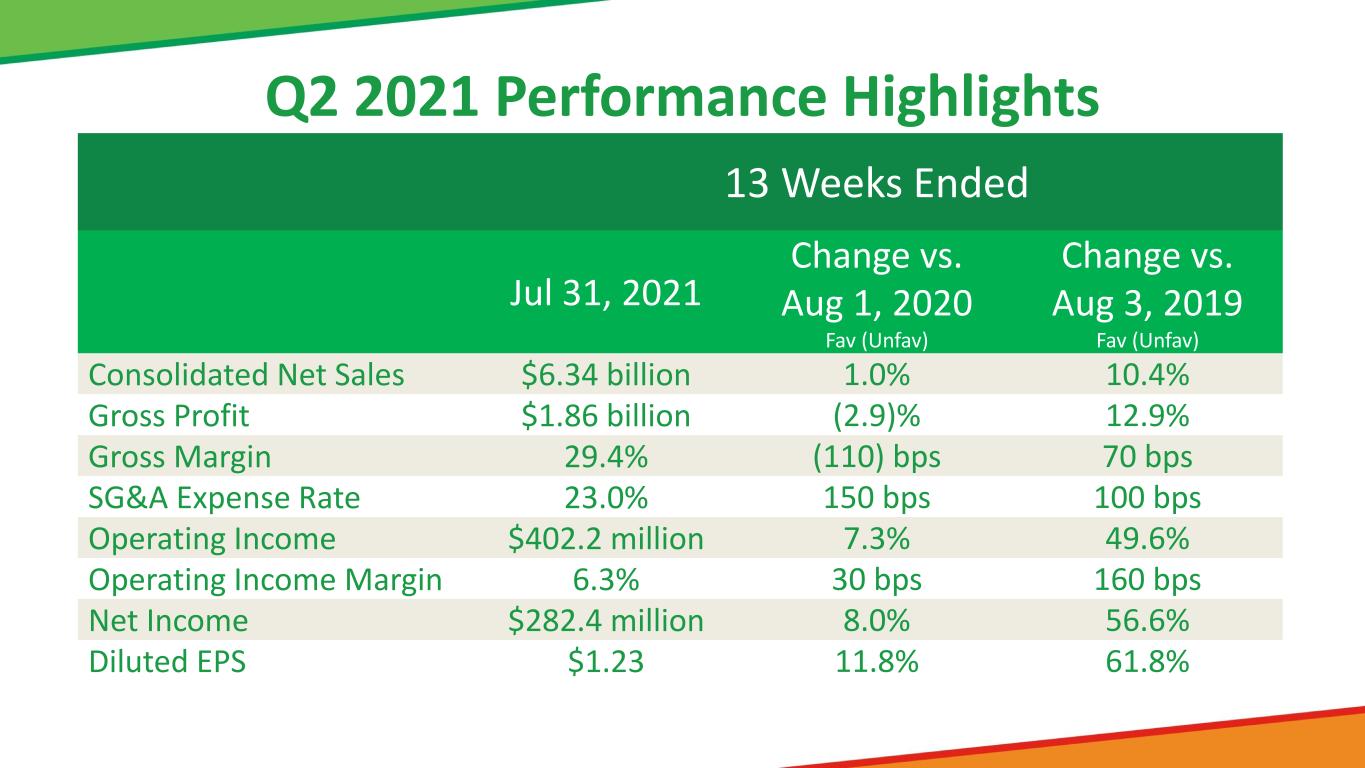
Q2 2021 Performance Highlights 13 Weeks Ended Jul 31, 2021 Change vs. Aug 1, 2020 Fav (Unfav) Change vs. Aug 3, 2019 Fav (Unfav) Consolidated Net Sales $6.34 billion 1.0% 10.4% Gross Profit $1.86 billion (2.9)% 12.9% Gross Margin 29.4% (110) bps 70 bps SG&A Expense Rate 23.0% 150 bps 100 bps Operating Income $402.2 million 7.3% 49.6% Operating Income Margin 6.3% 30 bps 160 bps Net Income $282.4 million 8.0% 56.6% Diluted EPS $1.23 11.8% 61.8%
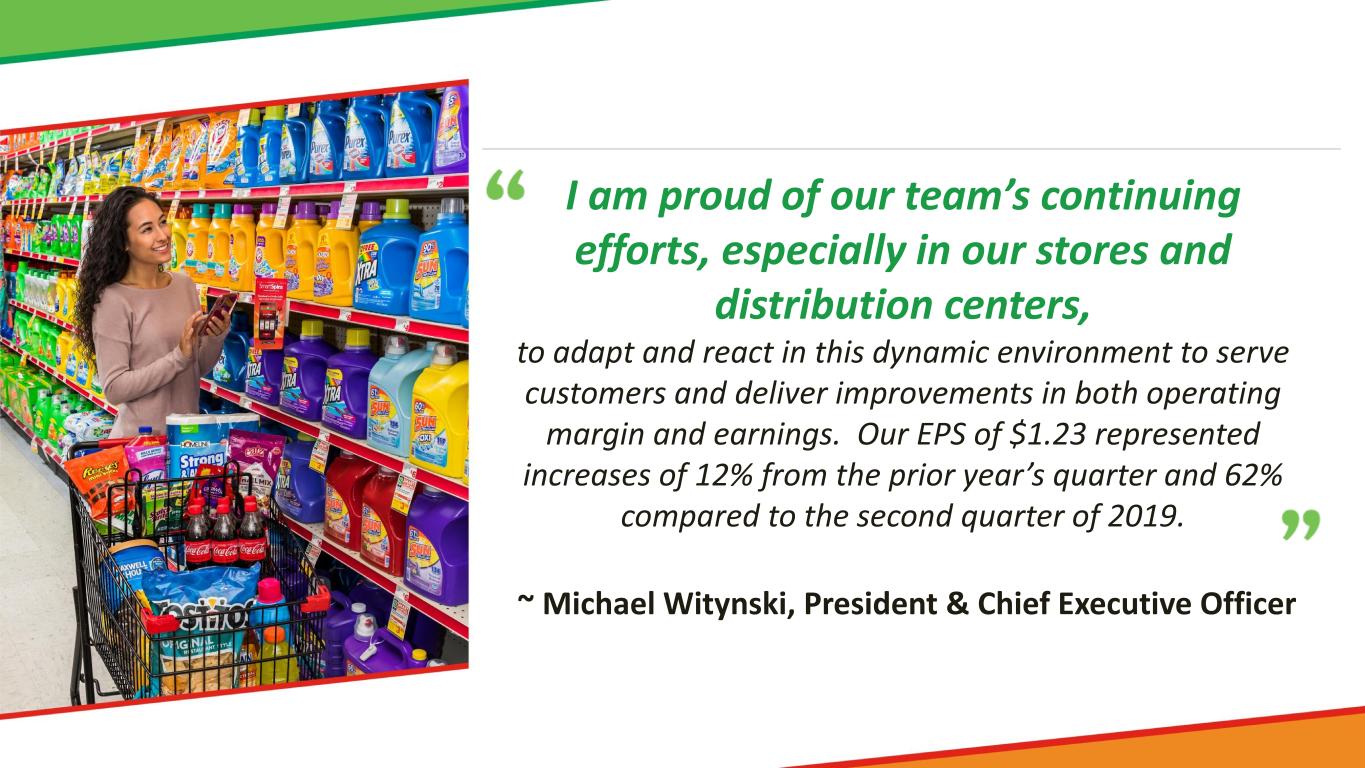
I am proud of our team’s continuing efforts, especially in our stores and distribution centers, to adapt and react in this dynamic environment to serve customers and deliver improvements in both operating margin and earnings. Our EPS of $1.23 represented increases of 12% from the prior year’s quarter and 62% compared to the second quarter of 2019. ~ Michael Witynski, President & Chief Executive Officer
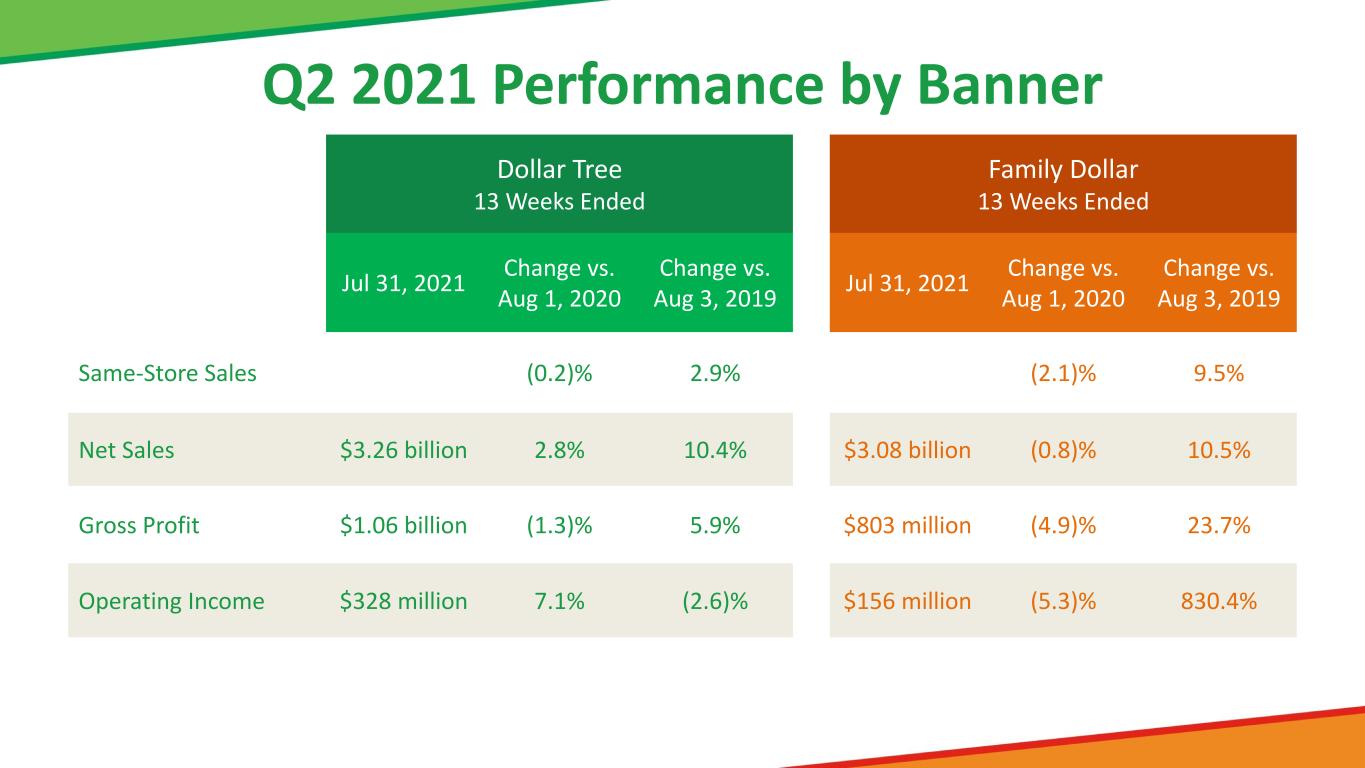
Q2 2021 Performance by Banner Dollar Tree 13 Weeks Ended Family Dollar 13 Weeks Ended Jul 31, 2021 Change vs. Aug 1, 2020 Change vs. Aug 3, 2019 Jul 31, 2021 Change vs. Aug 1, 2020 Change vs. Aug 3, 2019 Same-Store Sales (0.2)% 2.9% (2.1)% 9.5% Net Sales $3.26 billion 2.8% 10.4% $3.08 billion (0.8)% 10.5% Gross Profit $1.06 billion (1.3)% 5.9% $803 million (4.9)% 23.7% Operating Income $328 million 7.1% (2.6)% $156 million (5.3)% 830.4%
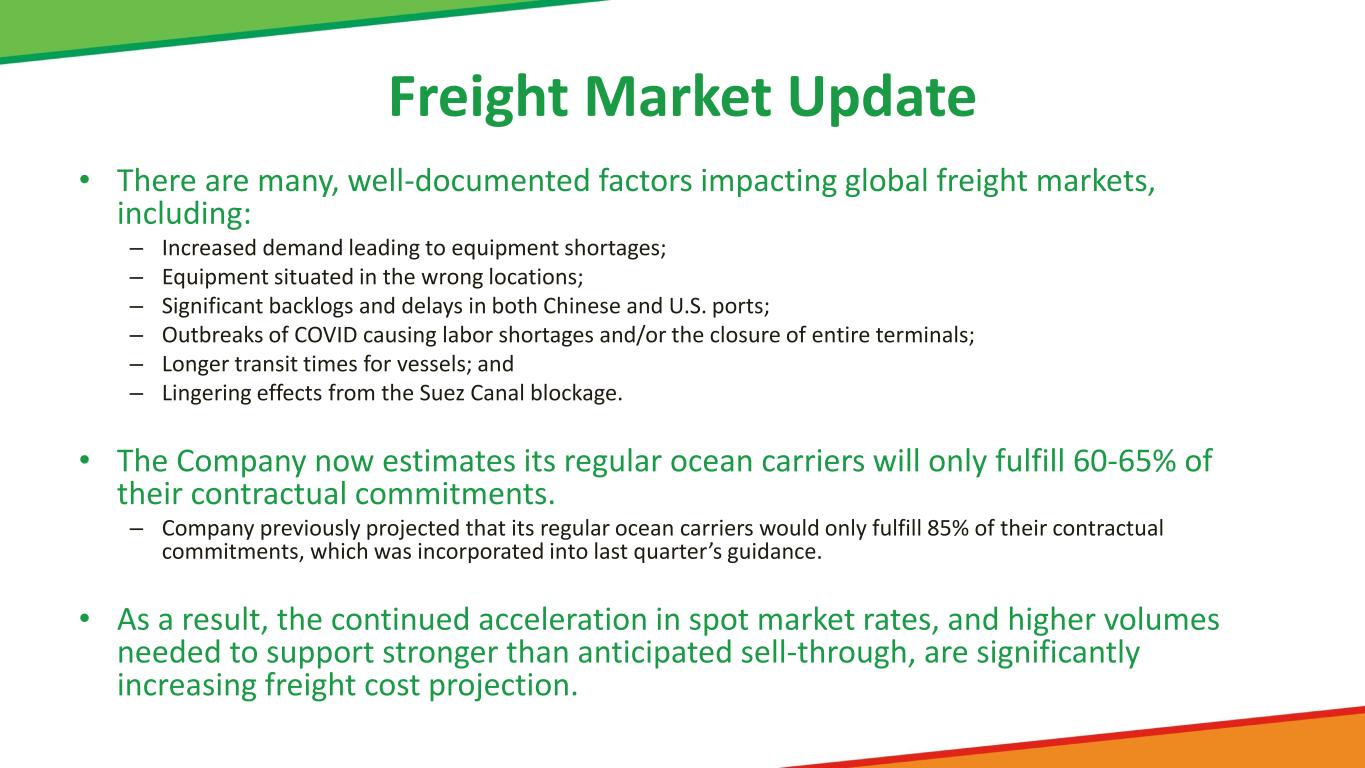
Freight Market Update • There are many, well-documented factors impacting global freight markets, including: – Increased demand leading to equipment shortages; – Equipment situated in the wrong locations; – Significant backlogs and delays in both Chinese and U.S. ports; – Outbreaks of COVID causing labor shortages and/or the closure of entire terminals; – Longer transit times for vessels; and – Lingering effects from the Suez Canal blockage. • The Company now estimates its regular ocean carriers will only fulfill 60-65% of their contractual commitments. – Company previously projected that its regular ocean carriers would only fulfill 85% of their contractual commitments, which was incorporated into last quarter’s guidance. • As a result, the continued acceleration in spot market rates, and higher volumes needed to support stronger than anticipated sell-through, are significantly increasing freight cost projection.
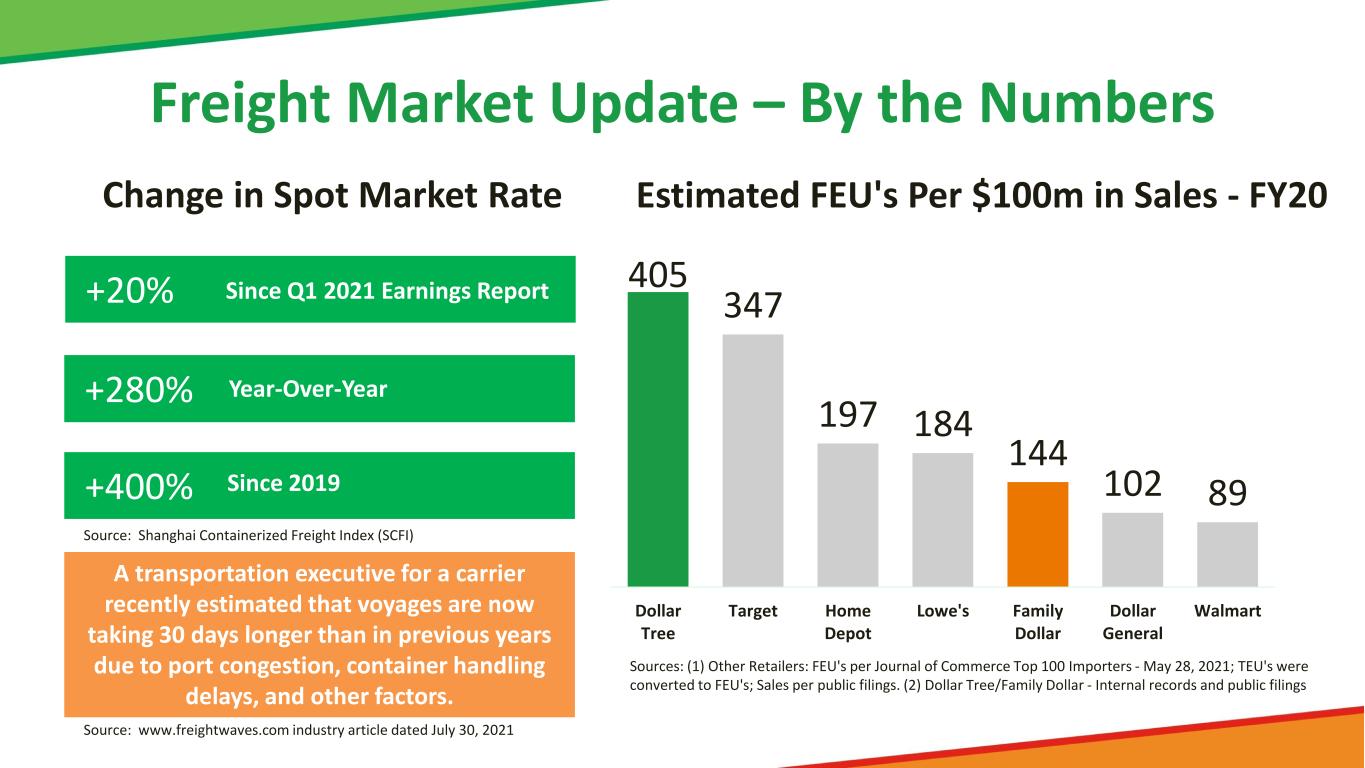
Freight Market Update – By the Numbers Change in Spot Market Rate +280% +20% +400% Since Q1 2021 Earnings Report Year-Over-Year Since 2019 Source: Shanghai Containerized Freight Index (SCFI) Estimated FEU's Per $100m in Sales ‐ FY20 405 347 197 184 144 102 89 Dollar Tree Target Home Depot Lowe's Family Dollar Dollar General Walmart Sources: (1) Other Retailers: FEU's per Journal of Commerce Top 100 Importers ‐ May 28, 2021; TEU's were converted to FEU's; Sales per public filings. (2) Dollar Tree/Family Dollar ‐ Internal records and public filings A transportation executive for a carrier recently estimated that voyages are now taking 30 days longer than in previous years due to port congestion, container handling delays, and other factors. Source: www.freightwaves.com industry article dated July 30, 2021

The supply chain issues, which we are confident are transitory in nature, will take some time until the global demand and supply for equipment is rebalanced. Importantly, we believe the foundation of our business is stronger than ever. ~ Michael Witynski
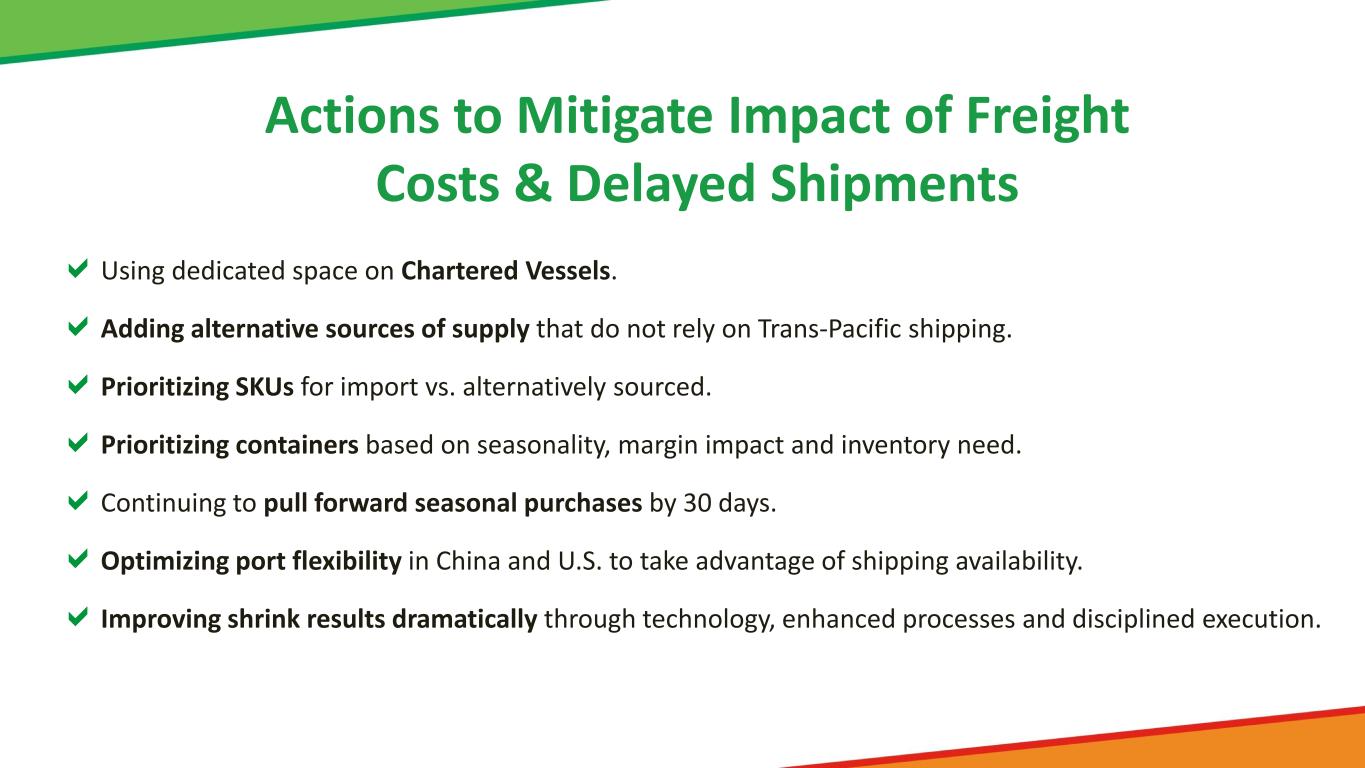
Actions to Mitigate Impact of Freight Costs & Delayed Shipments Using dedicated space on Chartered Vessels. Adding alternative sources of supply that do not rely on Trans-Pacific shipping. Prioritizing SKUs for import vs. alternatively sourced. Prioritizing containers based on seasonality, margin impact and inventory need. Continuing to pull forward seasonal purchases by 30 days. Optimizing port flexibility in China and U.S. to take advantage of shipping availability. Improving shrink results dramatically through technology, enhanced processes and disciplined execution.
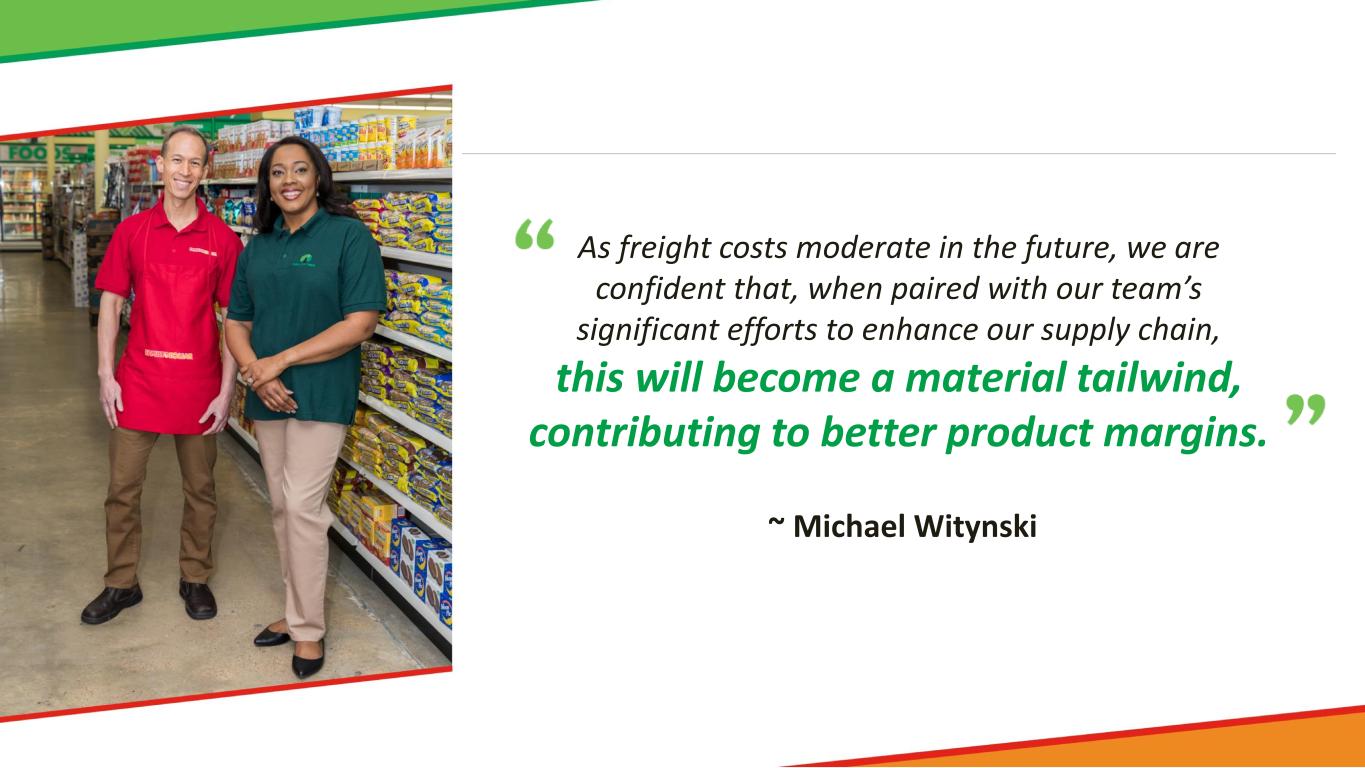
As freight costs moderate in the future, we are confident that, when paired with our team’s significant efforts to enhance our supply chain, this will become a material tailwind, contributing to better product margins. ~ Michael Witynski
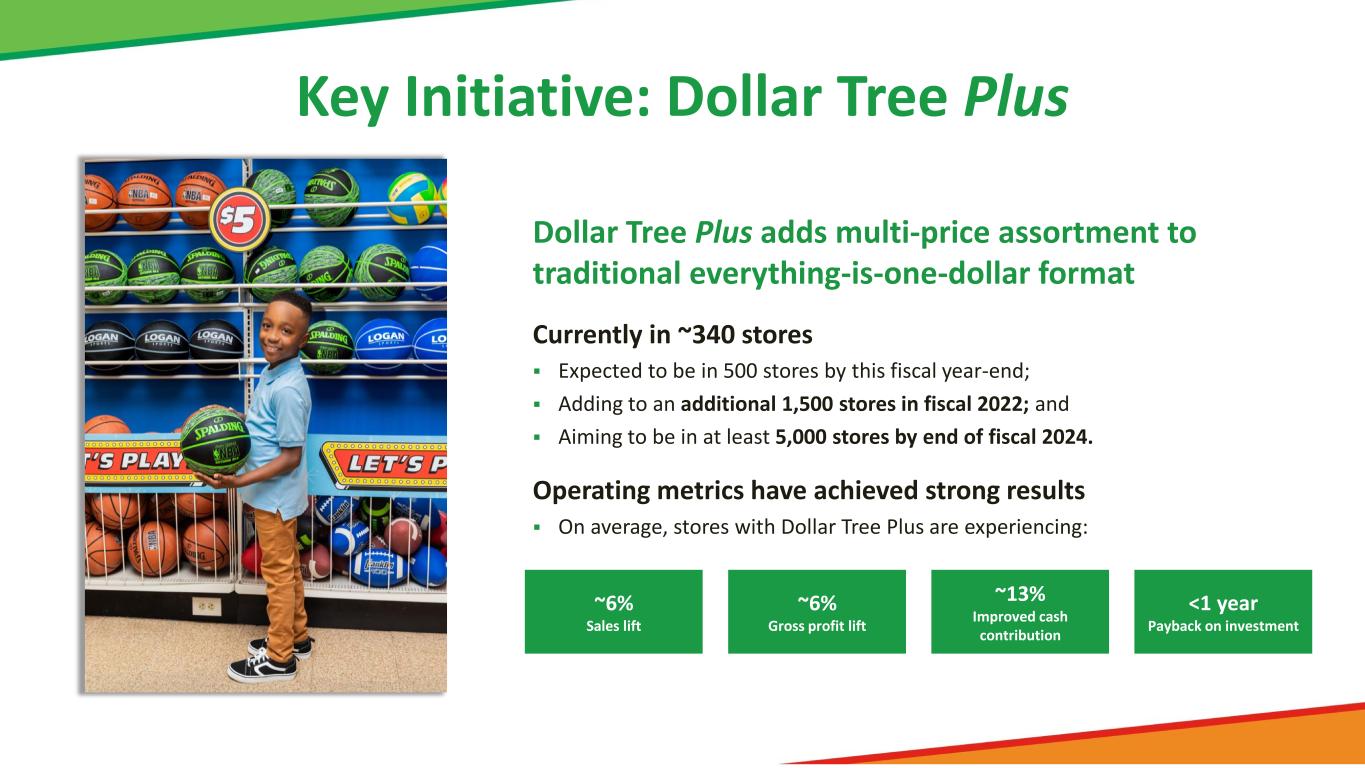
~6% Sales lift ~13% Improved cash contribution ~6% Gross profit lift <1 year Payback on investment Key Initiative: Dollar Tree Plus Dollar Tree Plus adds multi-price assortment to traditional everything-is-one-dollar format Currently in ~340 stores Expected to be in 500 stores by this fiscal year-end; Adding to an additional 1,500 stores in fiscal 2022; and Aiming to be in at least 5,000 stores by end of fiscal 2024. Operating metrics have achieved strong results On average, stores with Dollar Tree Plus are experiencing:
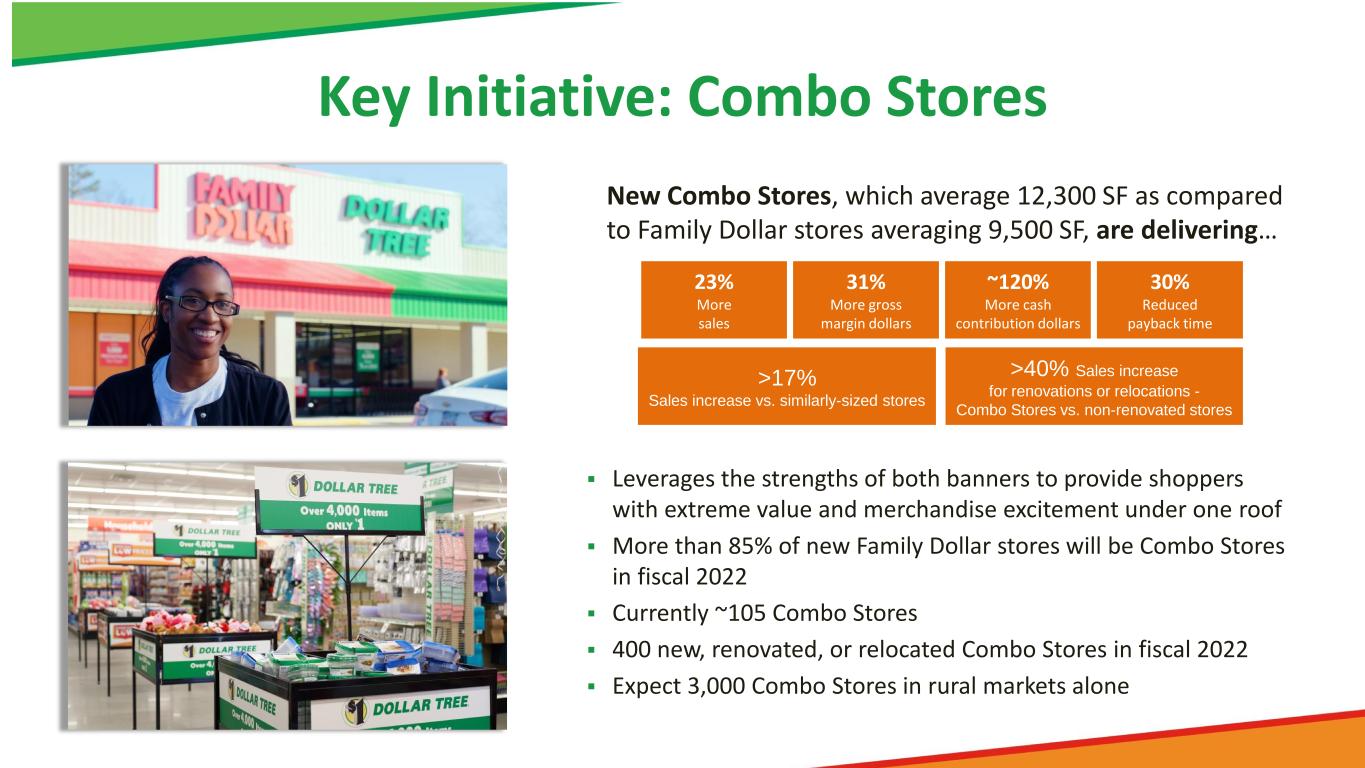
Key Initiative: Combo Stores Leverages the strengths of both banners to provide shoppers with extreme value and merchandise excitement under one roof More than 85% of new Family Dollar stores will be Combo Stores in fiscal 2022 Currently ~105 Combo Stores 400 new, renovated, or relocated Combo Stores in fiscal 2022 Expect 3,000 Combo Stores in rural markets alone New Combo Stores, which average 12,300 SF as compared to Family Dollar stores averaging 9,500 SF, are delivering… 23% More sales 31% More gross margin dollars ~120% More cash contribution dollars 30% Reduced payback time >17% Sales increase vs. similarly-sized stores >40% Sales increase for renovations or relocations - Combo Stores vs. non-renovated stores
Company Outlook For Full Year Fiscal 2021, the Company expects: • Consolidated net sales of $26.19 billion to $26.44 billion. • Low single-digit increase in consolidated same-store net sales. • Diluted EPS: between $5.40 and $5.60. • Estimated freight cost impact on Diluted EPS… – For fiscal 2021: $1.50 to $1.60 higher than fiscal 2020 • Capital expenditures: ~$1.1 billion Key Real Estate Initiatives for 2022 include: • Additional 1,500 Dollar Tree Plus stores, • 800 Family Dollar H2 Renovations, and • 400 new, renovated or relocated Combo Stores.
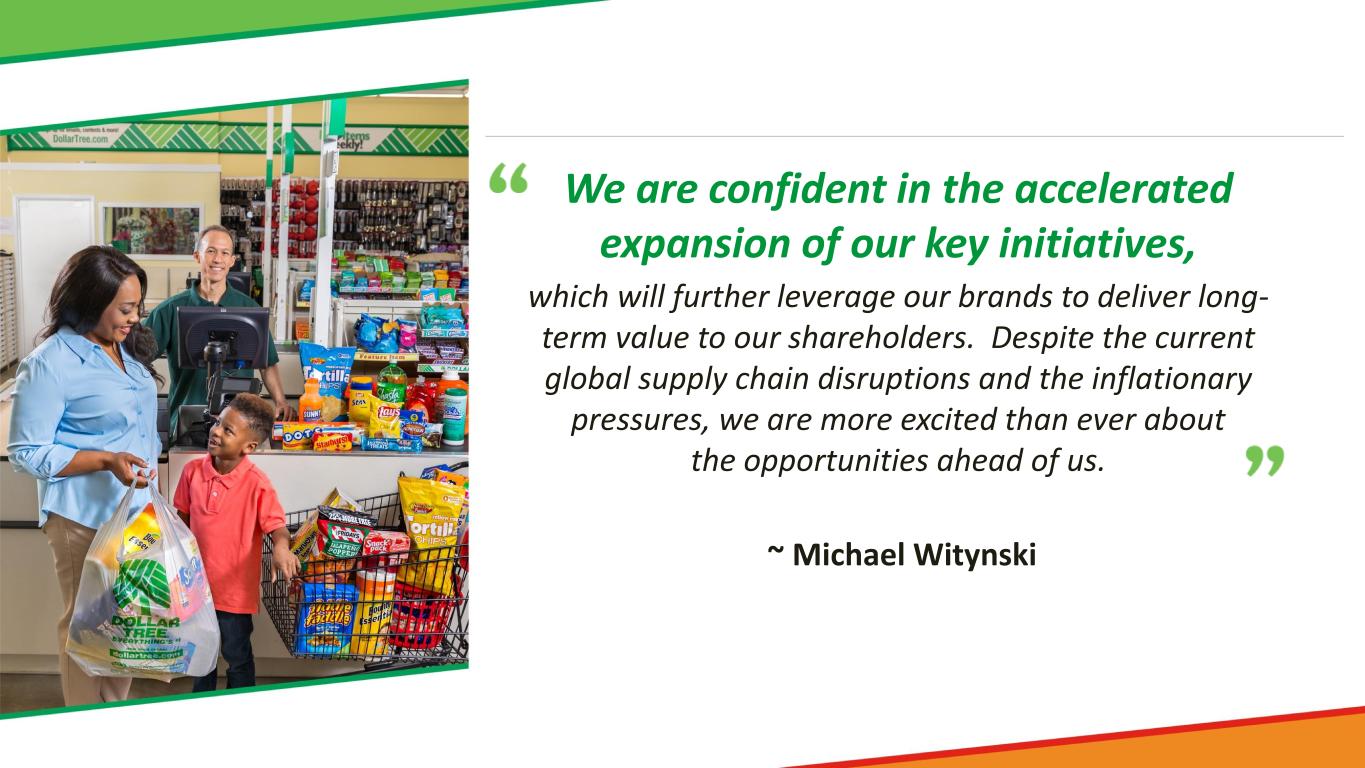
We are confident in the accelerated expansion of our key initiatives, which will further leverage our brands to deliver long- term value to our shareholders. Despite the current global supply chain disruptions and the inflationary pressures, we are more excited than ever about the opportunities ahead of us. ~ Michael Witynski
